Software measurement metrics
Software measurement metrics are critical in software engineering as they provide quantitative data that helps assess various aspects of the software development process and the quality of the software product. These metrics help project managers, developers, and quality assurance teams to monitor, control, and improve the development process, making decisions based on objective, data-driven insights.
Software metrics are typically divided into process metrics, product metrics, and project metrics, with each providing different insights into the software development lifecycle. Below is an overview of the key software metrics, how they are used, and what they measure:
1. Process Metrics
Process metrics measure the efficiency and effectiveness of the software development process itself. These help identify bottlenecks and areas for improvement in the development process.
- Defect Density: Measures the number of defects (bugs) found per unit of code, typically per 1,000 lines of code (KLOC).
- Formula:

-
- Purpose: Helps assess the quality of the code. A higher defect density indicates lower code quality or potential issues in the development process.
- Development Time: Measures the total time spent on the development phase of the project.
- Purpose: Provides insight into how long it takes to develop a particular module or feature, helping in future time estimation for similar tasks.
- Cycle Time: Measures the time it takes for a task or feature to go from being started to being completed.
- Purpose: Identifies bottlenecks and inefficiencies in the development process. A high cycle time can indicate that tasks are delayed or resources are not being used efficiently.
- Lead Time: Measures the total time taken from the moment a customer request is made until the feature is delivered.
- Purpose: Helps evaluate the responsiveness of the team and the speed of delivering value to the customer.
- Work In Progress (WIP): The number of items that are being worked on at any given time.
- Purpose: Helps identify overloading of the team or resources and can help in optimizing the development flow, especially in Agile and Kanban.
2. Product Metrics
Product metrics assess the quality of the software product and its ability to meet user needs and expectations. These metrics typically focus on the finished software and its behavior during testing or use.
- Code Churn: The amount of code that is modified, added, or deleted in a given time period.
- Purpose: High code churn might indicate instability in the codebase or frequent changes in project requirements. It can also point to issues with the initial design or requirements.
- Code Coverage: Measures the percentage of the code that is covered by automated tests (e.g., unit tests).
- Formula:

- Purpose: Helps assess how thoroughly the code is tested. Higher code coverage often correlates with higher software quality, though 100% code coverage does not guarantee defect-free software.
Cyclomatic Complexity: Measures the complexity of a program by calculating the number of linearly independent paths through the program’s source code.
- Formula:

- Where:
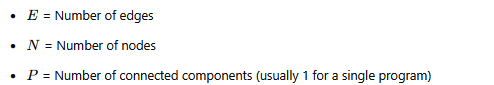
Purpose: Helps identify the complexity of code and potential areas that could be difficult to maintain or prone to defects.
- Function Points: Measures the functionality delivered to the user by the software, based on the software’s features and complexity.
- Purpose: Helps estimate the effort needed for development, maintenance, and testing based on the functionality required.
- Response Time: Measures the time taken for the system to respond to a user action or input.
- Purpose: A key performance metric. Slow response times can degrade the user experience.
- Defect Arrival Rate: Measures the rate at which defects are found during testing or in production.
- Purpose: Helps track the effectiveness of testing and identify problem areas in the software. A high arrival rate of defects might indicate insufficient testing or issues with code quality.
3. Project Metrics
Project metrics focus on tracking the progress and performance of the software development project itself, including budget, resources, and timelines.
- Cost Variance (CV): Measures the difference between the budgeted cost of work performed and the actual cost.

- urpose: Helps assess whether the project is on budget. A negative CV means the project is over budget.
Schedule Variance (SV): Measures the difference between the planned progress and the actual progress of the project.

- Purpose: Helps track whether the project is ahead or behind schedule. A negative SV means the project is delayed.
Earned Value (EV): Measures the value of work actually performed at a given point in time.
eam Velocity: Measures the amount of work a team can complete during a sprint (in Agile methodologies).
- Formula: Sum of story points completed in a sprint.
- Purpose: Helps in forecasting future sprints and understanding team performance.
Burn Down Chart: Tracks the amount of work remaining in the project or sprint.
- Purpose: Helps monitor the progress of the project and ensures that tasks are being completed on time. It shows a visual representation of work completion against the project timeline.
Defect Fix Rate: Measures the number of defects that have been fixed within a certain time period.
- Formula:

-
- Purpose: Helps evaluate the effectiveness of the development and QA teams in resolving defects.
4. Quality Metrics
Quality metrics measure how well the software meets the defined quality standards and how reliable and maintainable the software is over time.
- Maintainability Index: A software metric that indicates the ease with which software can be maintained and modified.
- Purpose: Helps assess the maintainability of the software, which is important for long-term sustainability.
- Mean Time to Failure (MTTF): Measures the average time the system operates before a failure occurs.
- Purpose: Helps assess the reliability of the system.
- Mean Time to Repair (MTTR): Measures the average time required to fix a defect or failure in the system.
- Purpose: Helps assess the responsiveness and efficiency of the team in addressing issues.
Conclusion
Software metrics are crucial for measuring the performance, quality, and efficiency of both the software product and the development process. They provide insight into where improvements can be made, help predict future performance, and guide decision-making throughout the software development lifecycle.
By regularly collecting and analyzing these metrics, development teams and project managers can:
- Identify potential problems early in the process.
- Optimize resources and timelines.
- Improve product quality and maintainability.
- Ensure that customer expectations are met.