
Regression Analysis (Statistical Estimation)
What is Regression Analysis?
Regression analysis is a statistical method used to model and analyze the relationship between one or more independent variables (predictors or factors) and a dependent variable (the outcome you’re trying to predict). In project estimation, regression analysis is applied to predict project parameters (e.g., cost, duration, effort) based on historical data and the relationships between different project factors.
🔹 Key Objective: Use historical data to establish a relationship between variables and predict project outcomes, such as cost, duration, or effort.
How Regression Analysis Works in Project Estimation
Regression analysis identifies the relationship between project variables by fitting data to a mathematical model. The output model can then be used to predict future outcomes based on known factors.
Key Steps in Regression Analysis for Estimation:
1. Define the Dependent and Independent Variables
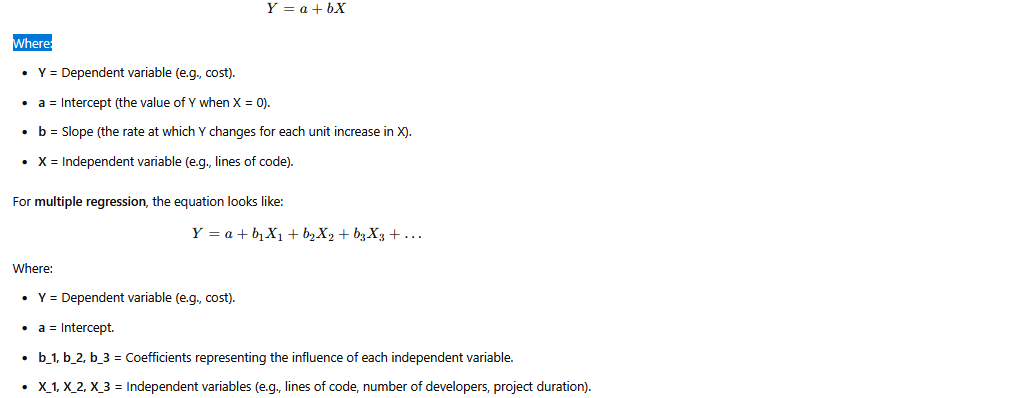
- Dependent Variable (Y): The outcome or parameter you want to estimate (e.g., cost, duration, or effort).
- Independent Variables (X): The factors or predictors that influence the dependent variable (e.g., project size, number of resources, complexity, etc.).
📌 Example:
- Dependent Variable (Y): Project cost.
- Independent Variables (X): Project size (e.g., number of lines of code, number of features), team size, project duration.
2. Collect Historical Data
Collect data from similar past projects that contain both the dependent variable and independent variables. This dataset is used to identify patterns and relationships that can be applied to the current project.
📌 Example Data:
| Lines of Code (X1) | Number of Developers (X2) | Project Duration (Months) (X3) | Cost (Y) |
|---|---|---|---|
| 1,000 | 3 | 4 | $50,000 |
| 2,000 | 5 | 6 | $80,000 |
| 1,500 | 4 | 5 | $60,000 |
| 2,500 | 6 | 7 | $100,000 |
3. Fit a Regression Model
Use statistical software or tools like Excel to analyze the relationship between independent and dependent variables. Based on the historical data, a regression model is created.
- Simple Linear Regression: Used when there’s only one independent variable.
- Multiple Linear Regression: Used when there are multiple independent variables influencing the dependent variable.
4. Develop the Regression Equation
The output of regression analysis will give you an equation that represents the relationship between the variables. In simple linear regression, the formula is:
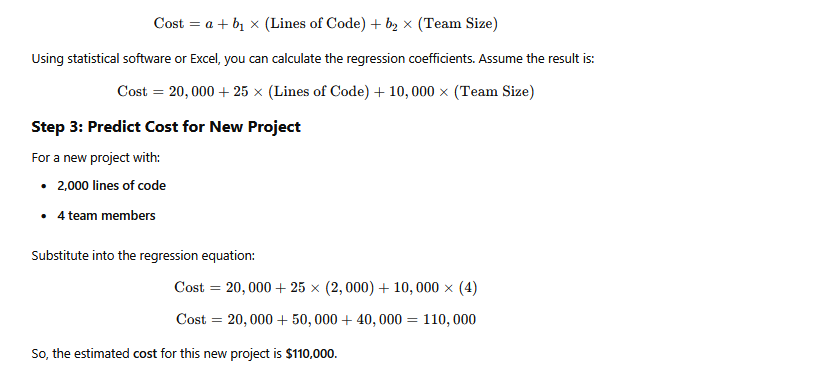
5. Apply the Model to Predict Outcomes
Once the regression equation is established, you can use it to estimate the dependent variable for a new project by plugging in the known values of the independent variables.
Types of Regression Analysis
1. Simple Linear Regression
This type of regression involves one independent variable and one dependent variable. The goal is to find the best-fitting straight line that represents the relationship between the two variables.

📌 Example:
In a software development project, cost (Y) could depend on the number of lines of code (X1), the number of developers (X2), and the project duration (X3).
3. Polynomial Regression
This method is used when the relationship between the independent and dependent variables is curved (non-linear). Polynomial regression fits a higher-degree polynomial to the data to model more complex relationships.
📌 Example:
For very large projects, cost may not increase linearly with the number of features, so a polynomial regression may better fit the data.
4. Logistic Regression
While linear regression predicts continuous outcomes, logistic regression is used when the dependent variable is binary (e.g., success/failure, yes/no decisions). Logistic regression estimates the probability of a binary outcome based on independent variables.
Advantages of Regression Analysis
✔ Data-Driven and Objective: Provides quantitative estimates based on real-world data, improving objectivity.
✔ Predictive Power: Allows you to predict future project outcomes with a level of accuracy, especially when reliable historical data is available.
✔ Handles Multiple Variables: Multiple regression accounts for the influence of multiple factors, which is useful for complex projects.
✔ Transparency: The regression equation provides a clear explanation of how various factors impact project outcomes.
✔ Widely Applicable: Can be used in a variety of domains, including construction, software development, and manufacturing.
Disadvantages of Regression Analysis
❌ Requires Sufficient Data: Regression analysis needs ample historical data for reliable predictions.
❌ Assumption of Linear Relationships: In simple and multiple regression, the model assumes a linear relationship between the independent and dependent variables, which may not always be accurate.
❌ Sensitivity to Outliers: Outliers or extreme data points can significantly affect the model’s accuracy.
❌ Complexity: Regression models can become complex with multiple variables and may be difficult to interpret without statistical expertise.
❌ Data Quality: Poor or incomplete data can compromise the accuracy of the model and lead to faulty predictions.
When to Use Regression Analysis for Estimation
1. When Data Is Available
Regression analysis requires historical data that relates project parameters (e.g., cost, duration) to specific variables (e.g., number of features, team size, complexity). It’s best suited for projects with sufficient data from past work.
2. When Multiple Factors Affect the Outcome
Regression analysis is useful when there are multiple variables influencing the outcome of the project. For example, project cost may depend on the number of features, complexity, team experience, and timeline.
3. For Predicting Quantitative Outcomes
Regression analysis is most useful when estimating continuous outcomes such as cost, effort, or duration, and when you need a precise numeric estimate.
Example of Regression Analysis for Project Estimation
Step 1: Historical Data
Let’s assume we have historical data on the cost of software projects based on the lines of code and team size.
| Lines of Code (X1) | Team Size (X2) | Cost (Y) |
|---|---|---|
| 1,000 | 3 | $50,000 |
| 2,000 | 4 | $75,000 |
| 1,500 | 3 | $60,000 |
| 2,500 | 5 | $100,000 |
Step 2: Fit the Regression Model
Let’s apply multiple linear regression to create a formula:
Tools for Regression Analysis in Project Estimation
✔ Microsoft Excel: Use the Data Analysis Toolpak to perform regression analysis. ✔ R and Python: Use libraries such as scikit-learn (Python) or statsmodels (Python) for performing regression analysis. ✔ Minitab: A statistical software used for regression analysis and modeling. ✔ SPSS: A tool for advanced statistical analysis, including regression.
Conclusion
Regression analysis is a powerful statistical tool for predicting project parameters (such as cost, duration, and effort) based on historical data. It helps you understand the relationship between different project variables and make data-driven predictions. While it offers accuracy and predictive power, it also requires reliable data and proper modeling to produce useful estimates.
✅ Key Takeaways: ✔ Data-driven predictions provide greater reliability and insight.
✔ Multiple linear regression is ideal when multiple factors influence the outcome.
✔ Ensure data is accurate, complete, and relevant to the current project.